The easiest way to run Bayesian analyses in R is through the brms library. This library allows for the fitting of generalized linear and nonlinear multilevel models, using syntax similar to that of the lme4 library. The brms library uses Stan, which requires a C++ compiler. Running R Studio on Beocat through OpenOnDemand gives access to a C++ compiler, allows for multiple user-specified cores, and allows for time-consuming analyses to be run separately from your personal computer.
Notes on libraries:
- To install the latest version of brms, use
install.packages(“brms”) - The bayesplot library can be used to create ggplot objects from Bayesian models, so you can create figures using customization available in the ggplot2 package. Bayesplot can be installed through
install.packages(“bayesplot”), and ggplot 2 can be installed throughinstall.packages(“ggplot2”), or through the tidyverse packageinstall.packages(“tidyverse”). - To install all dependencies for any library (optional), add
dep=Tto the end of your install command. Example:install.packages("brms",dep=T) - If you have been given code to download libraries from your instructor, follow those specific install instructions to ensure you are using the same library versions as your class.
For more information on brms, visit https://cran.r-project.org/web/packages/brms/readme/README.html.
For bayesplot information, visit https://mc-stan.org/bayesplot/.
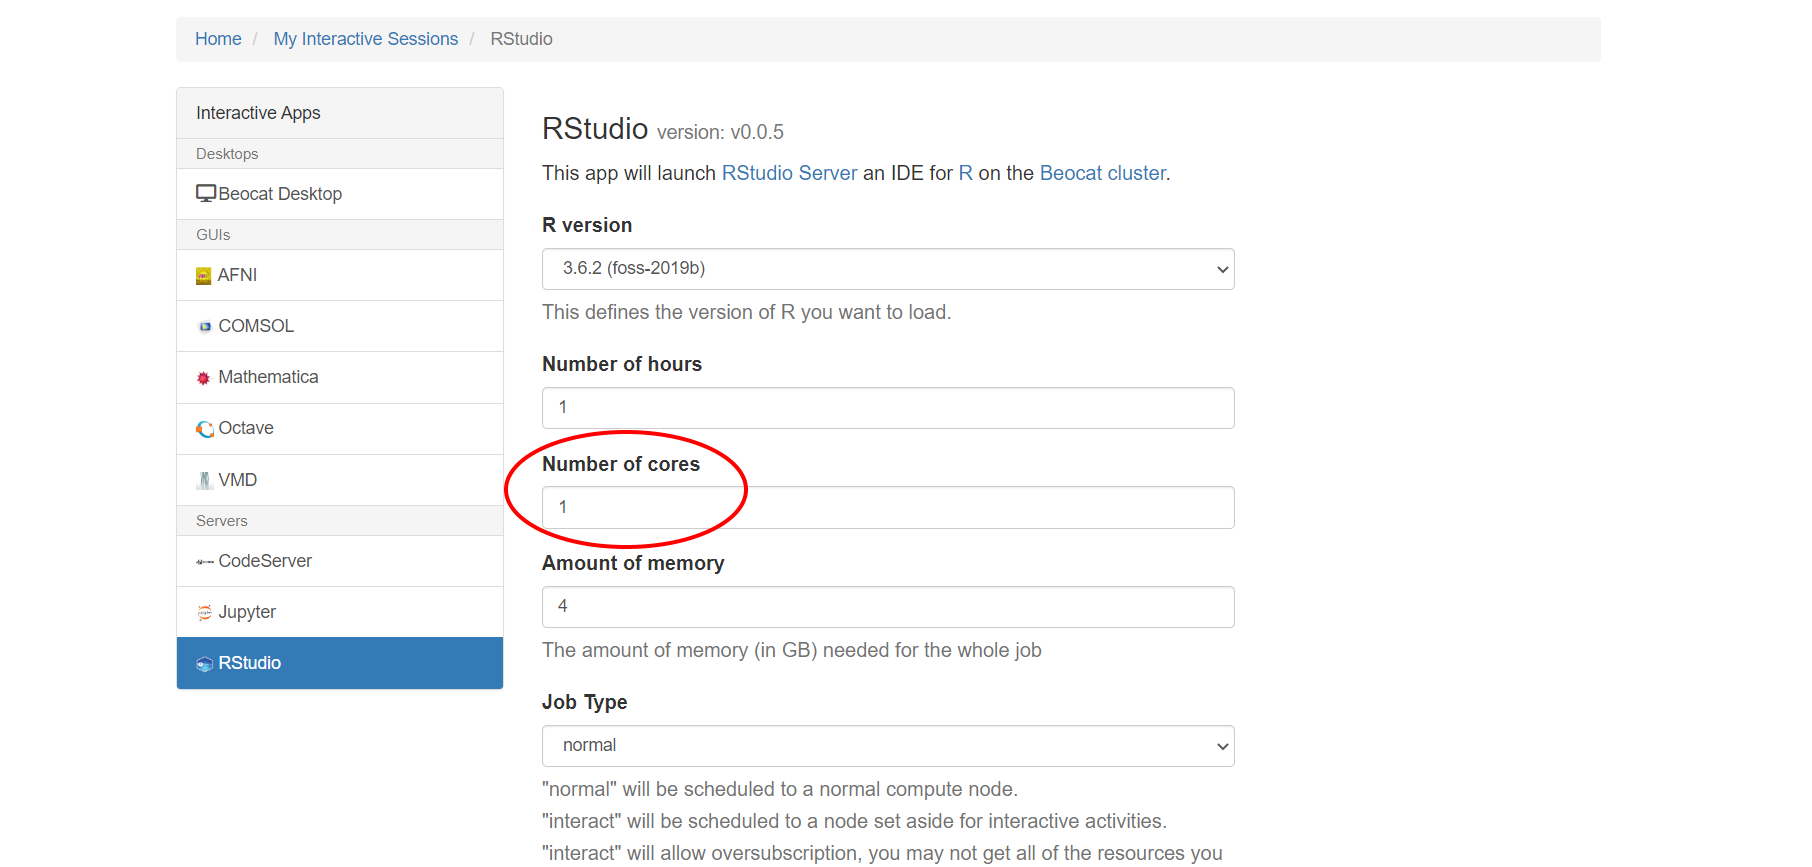
Cores
In the setup for an R Studio OpenOnDemand Session, you can specify how many cores you would like to use. Similarly, you can designate a number of cores for the brms function to take advantage of in the syntax of your model.
For example, if you want to use 4 cores in your model, specify cores=4, in your model syntax:
library(brms)
Model1<-brm(DV ~ IV, data = mydata, prior=c(set_prior("normal(0,2)", class= "b")), chains = 4, cores=4)
Bayesian analyses through brms will run 4 chains by default, so by default it can take advantage of up to 4 cores in parallel. If you would like to run more chains parallelized across multiple cores, you can request the number of cores up to the number of chains you would like.
Checking Cores
If you have been running models on your home computer, and would like to check how many cores you have, you can use:
library(parallel)
detectCores()
This is also useful for checking the number of cores available in your R OpenOnDemand session.
Note: there are methods for further parallelizing your chains. If you have a model that is taking multiple days to run, consider within chain parallelization. The specifics of this setup may depend on your model. If you need assistance making your model run faster, email karipayne@ksu.edu.
General Commands
library(brms)
model1 <- brm(DV ~ IV, data=mydata)
summary(model1)
The summary() command will give you information about your MCMC (Markov Chain Monte Carlo) sampling (how many chains, iterations, warmups), your group level effects, and your main effects (called Population-Level Effects in the output).
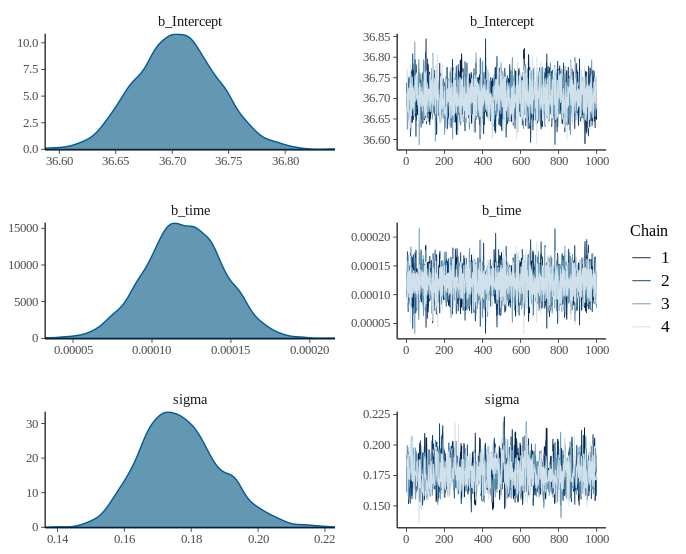
plot(model1)
The plot() command will give you your distribution, and a visualization of your MCMC chains.
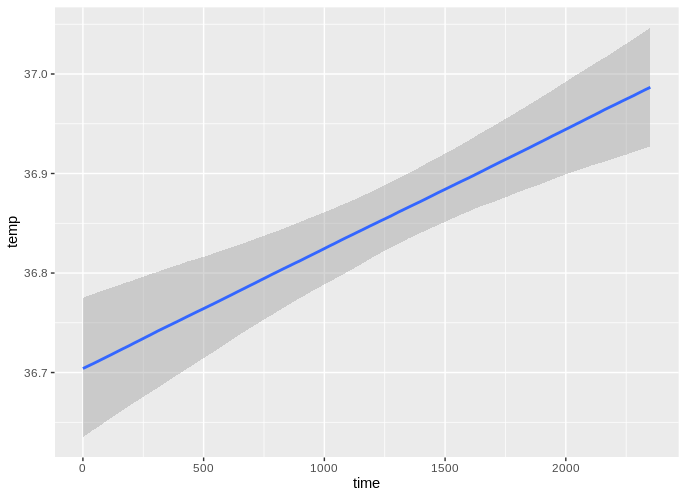
conditional_effects(model1)
The conditional_effects() command gives you figures of the individual effects of your IVs on your DV.